No questions? Good now we can move on to in game strategy.
In-game strategy
During Team 1's innings
Strategy for Team 1
During Team 1's innings, the target score calculations (as described above), have not yet been made.
The objective of the team batting first is to maximise the target score which will be calculated for the team batting second, which (in the Professional Edition) will be determined by the formula:
Team 2's par score = Team 1's score × Team 2's resources Team 1's resources . {\displaystyle {\text{Team 2's par score }}={\text{ Team 1's score}}\times {\frac {\text{Team 2's resources}}{\text{Team 1's resources}}}.} {\displaystyle {\text{Team 2's par score }}={\text{ Team 1's score}}\times {\frac {\text{Team 2's resources}}{\text{Team 1's resources}}}.}
For these three terms:
Team 1's score: Team 1 will always increase Team 2's target by increasing their own score.
At the start of Team 2's innings, Team 2's resources will be 10 wickets and the number of overs available, and Team 1 cannot affect this.
Team 1's resources are given by:
Total resources available = 100% − Resources lost by 1st interruption − Resources lost by 2nd interruption − Resources lost by 3rd interruption − ...
If there will not be any future interruptions to Team 1's innings, then the amount of resource available to them is now fixed (whether there have been interruptions so far or not), so the only thing Team 1 can do to increase Team 2's target is increase their own score, ignoring how many wickets they lose (as in a normal unaffected match).
However, if there will be future interruptions to Team 1's innings, then an alternative strategy to scoring more runs is minimising the amount of resource they use before the coming interruption (i.e. preserving wickets). While the best overall strategy is obviously to both score more runs and preserve resources, if a choice has to be made between the two, sometimes preserving wickets at the expense of scoring runs ('conservative' batting) is a more effective way of increasing Team 2's target, and sometimes the reverse ('aggressive' batting) is true.
Percentage total resources remaining reference table (D/L Standard Edition)[21] Overs remaining Wickets in hand
10 8 6 4 2
50 100.0 85.1 62.7 34.9 11.9
40 89.3 77.8 59.5 34.6 11.9
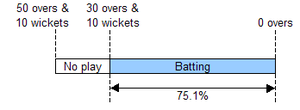
30 75.1 67.3 54.1 33.6 11.9
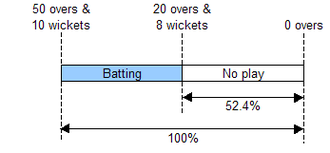
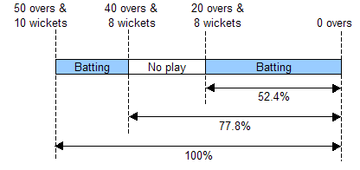
20 56.6 52.4 44.6 30.8 11.9
10 32.1 30.8 28.3 22.8 11.4
5 17.2 16.8 16.1 14.3 9.4
For example, suppose Team 1 has been batting without interruptions, but thinks the innings will be cut short at 40 overs, i.e. with 10 overs left. (Then Team 2 will have 40 overs to bat, so Team 2's resource will be 89.3%.) Team 1 thinks by batting conservatively it can reach 200–6, or by batting aggressively it can reach 220–8:
Batting strategy Conservative Aggressive
Runs Team 1 thinks it can score 200 220
Wickets Team 1 thinks it will have in hand 4 2
Resource remaining to Team 1 at cut-off 22.8% 11.4%
Resource used by Team 1 100% − 22.8% = 77.2% 100% − 11.4% = 88.6%
Team 2's par score 200 x 89.3% / 77.2%
= 231.35 runs 220 x 89.3% / 88.6%
= 221.74 runs
Therefore, in this case, the conservative strategy achieves a higher target for Team 2.
Percentage total resources remaining reference table (D/L Standard Edition)[21] Overs remaining Wickets in hand
10 8 6 4 2
50 100.0 85.1 62.7 34.9 11.9
40 89.3 77.8 59.5 34.6 11.9
30 75.1 67.3 54.1 33.6 11.9
20 56.6 52.4 44.6 30.8 11.9
10 32.1 30.8 28.3 22.8 11.4
5 17.2 16.8 16.1 14.3 9.4
However, suppose instead that the difference between the two strategies is scoring 200–2 or 220–4:
Batting strategy Conservative Aggressive
Runs Team 1 thinks it can score 200 220
Wickets Team 1 thinks it will have in hand 8 6
Resource remaining to Team 1 at cut-off 30.8% 28.3%
Resource used by Team 1 100% − 30.8% = 69.2% 100% − 28.3% = 71.7%
Team 2's par score 200 x 89.3% / 69.2%
= 258.09 runs 220 x 89.3% / 71.7%
= 274.00 runs
In this case, the aggressive strategy is better.
Therefore, the best batting strategy for Team 1 ahead of a coming interruption is not always the same, but varies with the facts of the match situation to date (runs scored, wickets lost, overs used, and whether there have been interruptions), and also with the opinions about what will happen with each strategy (how many further runs will be scored, further wickets will be lost, and further overs will be used? How likely are the coming interruptions, when will they happen, and how long will they last – will Team 1's innings be re-started?).
This example shows just two possible batting strategies, but in reality there could be a range of others, e.g. 'neutral', 'semi-aggressive', 'super-aggressive', or timewasting to minimise the amount of resource used by slowing the over rate. Finding which strategy is the best can only be found by inputting the facts and one's opinions into the calculations and seeing what emerges.
Of course, a chosen strategy may backfire. For example, if Team 1 chooses to bat conservatively, Team 2 may see this and decide to attack (rather than focus on saving runs), and Team 1 may both fail to score many more runs and lose wickets.
Note also that if there have already been interruptions to Team 1's innings, the calculation of total resource they use will be more complicated than this example.
Strategy for Team 2
During Team 1's innings, Team 2's objective is to minimise the target score they will be set. This is achieved by minimising Team 1's score, or (as above), if there will be future interruptions to Team 1's innings, alternatively by maximising the resource used by Team 1 (i.e. wickets lost or overs bowled) before that happens. Team 2 can vary their bowling strategy (between conservative and aggressive) to try and achieve either of these objectives, so this means doing the same calculations as above, inputting their opinions of future runs conceded, wickets taken and overs bowled in each bowling strategy, to see which one is best.
Also, Team 2 can encourage Team 1 to bat particularly conservatively or aggressively (e.g. through field settings).
During Team 2's innings
A target (from a given number of overs) is set for Team 2 at the start of its innings. If there will not be any future interruptions, then both sides can play to a finish in the normal way. However, if there are likely to be interruptions to Team 2's innings, then Team 2 will aim to keep itself ahead of the D/L par score, and Team 1 will aim to keep them behind it. This is because, if a match is abandoned before the given number of overs is complete, Team 2 is declared the winner if they're ahead of the par score, and Team 1 is declared the winner if Team 2 are behind the par score. A tie is declared if Team 2 are exactly on the par score. (This is provided a minimum number of overs has been bowled in Team 2's innings.)
The par score increases with every ball bowled and every wicket lost, as the amount of resource used increases. As an example, in the 2003 Cricket World Cup Final Australia batted first and scored 359 from 50 overs. As Australia completed their 50 overs, their total resources used R1=100%, so India's par score throughout their innings was: 359 x R2/100%, where R2 is the amount of resource used to that point. As shown in the first line of the table below, after 9 overs India were 57-1, and 41 overs and 9 wickets remaining equates to 85.3% of resources, so 100% − 85.3% = 14.7% had been used. India's par score after 9 overs was therefore 359 x 14.7%/100% = 52.773, which is rounded down to 52.
During the six balls of the 10th over India scored 0, 0, 0, 1 (from a no ball), loss of wicket, 0.[51] At the start of the over India were ahead of the par score, but the loss of the wicket caused their par score to jump from 55 to 79, which put them behind the par score.
Overs used 1 wicket lost 2 wickets lost India's actual score
Resources remaining Resources used (R2) D/L par score Resources remaining Resources used (R2) D/L par score
9.0 85.3% 14.7% 52.773 52 78.7% 21.3% 76.467 76 57-1
9.1 85.1% 14.9% 53.491 53 78.5% 21.5% 77.185 77 57-1
9.2 84.9% 15.1% 54.209 54 78.4% 21.6% 77.544 77 57-1
9.3 84.7% 15.3% 54.927 54 78.2% 21.8% 78.262 78 57-1
9.4 84.6% 15.4% 55.286 55 78.1% 21.9% 78.621 78 58-1
9.5 84.4% 15.6% 56.004 56 77.9% 22.1% 79.339 79 58-2
10.0 84.2% 15.8% 56.722 56 77.8% 22.2% 79.698 79